- Track your orders
- Save your details for express checkout

Shopping
| What's Really Driving the Cost of Rates in Waitomo? How do we compare with similar councils - and where are we out of step? Most importantly, what can we do to get real results? I'll be doing a series to walk you through the numbers step by step - showing where the costs are, how we stack up, and what needs to change. Let's get beyond the headlines, understand what's really going on, and start building solutions that work - for today and the future |
||||||||||
 Ever wondered how the council budget works?
There’s an overall budget made up of the total costs to run the district — things like roads, water, rubbish, community services, and more. Part of that is funded by rates, and part by other income like funding from Waka Kotahi (NZTA), government grants, and fees.
For Waitomo District in the 2024/25 year, other income also included a dividend from Inframax Construction Limited, a company 100% owned by Waitomo District Council — meaning it's owned by the people of our district.
The council is required to balance the books — revenue must match expenses. Councils are not in the business of making a surplus or profit. The aim is to fund what’s needed, fairly and sustainably.
Keep an eye out for an upcoming post where I break down how your share of the total rates bill is worked out — and what it means for your property!
|
||||||||||
|
2 August 2025 I’ve been thinking a lot about how we talk about rates and services — and I believe we need more open and honest conversations about who is actually paying for what, and what the real savings are when a service is cut.
Here’s an example: the total capital value of all properties in the Waitomo District is nearly $5 billion. Half of that — about $2.48 billion — comes from just 952 farms (120 dairy and 832 pastoral). So, when we fund things through capital value, those farms are footing a big part of the bill – pretty much half!
Let’s say Council removes a $30,000 service to "save ratepayers money." Sounds good, right?
But dig a little deeper – if it was part of “general” rates charged on capital value:
So, the real question is: would you rather save $3, or keep the service?
And there’s more to consider — in 2012 there were 1,181 farms making up 62% of the district’s capital value. That number has already dropped by over 200 and the percentage to 50% of the district’s capital value.
As farm numbers/values fall, more of the rating burden shifts onto other ratepayers. This is why it is critical to plan ahead and build our economy to replace income from sectors that are changing.
Let’s keep it real and talk about the big picture — not just the headlines.
Over the next few weeks, I’ll walk you through how I arrived at these figures — step by step — and show how Waitomo compares to our neighbours and two similar districts.
Only when we understand how something works can we truly see where it isn’t working. Then we can work on solutions together.
|
||||||||||
|
7 August 2025
In my post on 24 July, I explained how Council’s income comes from two main sources:
This graph shows how those amounts have changed over time — from 2011/12 right through to forecasts for 2024/25 and 2025/26.
________________________________________
The biggest single item is the roading subsidy we get from Waka Kotahi/NZTA to help pay for our local roads. This is called a FAR (Funding Assistance Rate).
• Between 2014/15 and 2021/22, NZTA roading subsidies averaged $7.5 million per year
• After storm events in 2022 and 2023, this jumped to $12.9 million (2022/23) and $18.3 million (2023/24)
• Since 2020, Waitomo has received over $50 million in roading subsidies
•
•
•
•
•
•
•
•
•
________________________________________
Understanding where Council revenue comes from helps us all make sense of the big picture.
In future posts, I’ll dive into how this income is allocated — and what it means for your rates bill.
For transparency: I used my paid ChatGPT account to help make the wording clearer, but all data, graphs and analysis come from me, using publicly available sources
Authorised by Janette Osborne, 2879 Hauturu Road, RD8, Te Kuiti
|
||||||||||
|
10 August 2025
How Do We Compare – Mix of Total Income: Rates + Other Revenue In my post on 7 August, I showed the mix of income for Waitomo District Council — how much comes from rates vs other sources.
Today, let’s see how we stack up against four other councils:
________________________________________
A quick reminder – where this data comes from:
Councils all work to the same planning cycle:
Right now, the 2024/25 Annual Reports aren’t out yet, so I’ve used two points in time:
Think of the Annual Plan as “what we expect will happen” and the Annual Report as “what really happened”.
________________________________________
What the numbers say
________________________________________
In my next post, we’ll look at how these five councils compare across a range of statistics — population, district size, kilometres of road, and more. This will give context for when we compare figures.
And after that, I’ll show how total rates have changed over time — and where Waitomo sits in that trend. Then we’ll move onto breaking down what the total rates are made up of – eg water, roading etc and how that compares across councils.
|
||||||||||
17 August 2025
Let’s Talk Rates – and Why Comparisons Matter
To really understand how Waitomo’s rates stack up, we first need to look at the bigger picture and compare ourselves with similar districts.
So why these five?
• Otorohanga & Ruapehu – our neighbours, right on our border.
• Opotiki & Wairoa – small rural councils, similar in size, population mix, and challenges.
I’ve sifted through a lot of data (the hardest part was deciding what not to include!). If you’ve got questions, ask away – chances are I’ve already compared it.
And where better to start than with the most important part of any district: our people.
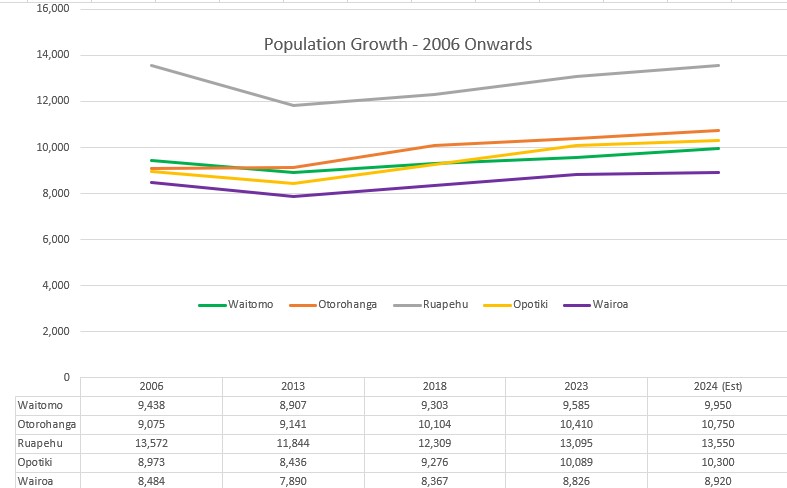
• Ruapehu has the largest population at 13,550.
• Waitomo, Otorohanga & Opotiki each sit around 10,000.
• Wairoa is smaller, just under 9,000.
Over the last 20 years, growth across all five has been relatively flat.
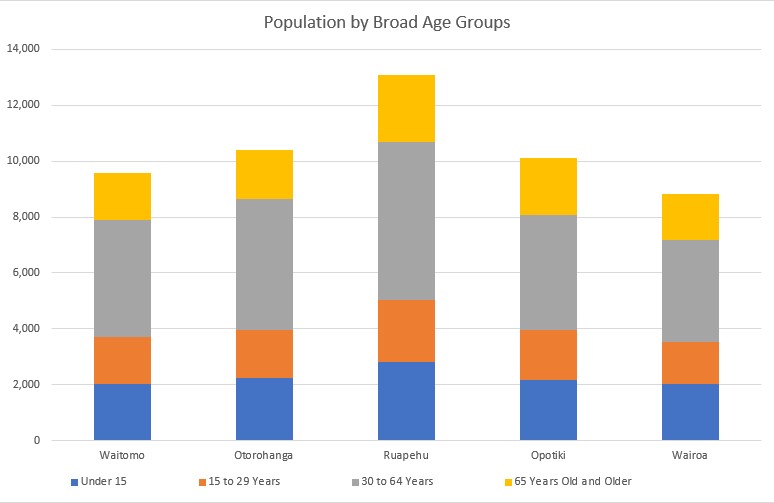
Looking at the 2023 Census, the broad age groupings across our five comparison districts are surprisingly similar. But when we zoom in on Waitomo, there are some important trends we need to plan for.
I’ll be breaking this down further in an upcoming post – because understanding our population is the first step to planning for a resilient and thriving Waitomo.
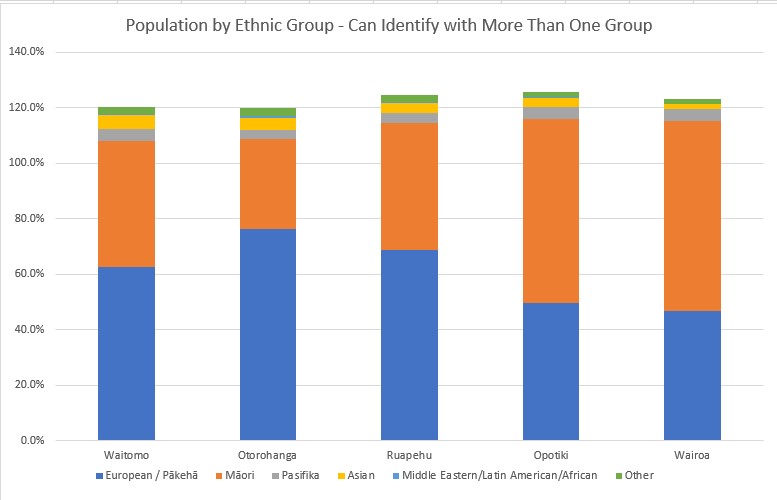
In Waitomo, 45% of our population identifies as Māori. That’s a higher proportion than Otorohanga and very similar to Ruapehu. In comparison, both Ōpōtiki and Wairoa have almost 70% of their communities identifying as Māori.
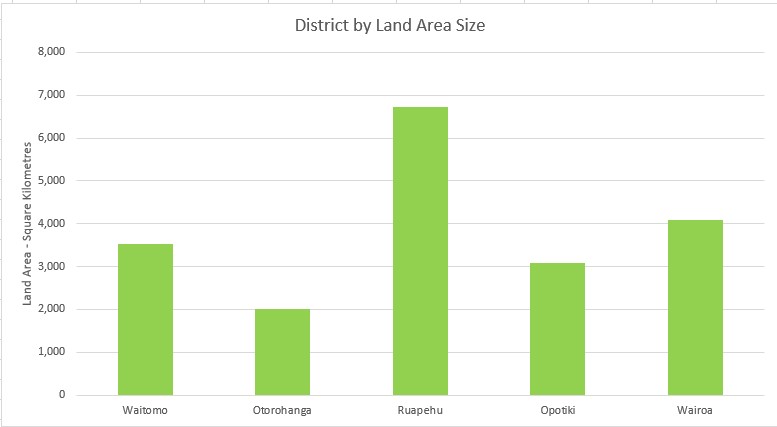
When we look at land area, Ōpōtiki is the closest in size to Waitomo. Wairoa is a little larger, Ruapehu is significantly bigger, while Otorohanga covers a smaller area.
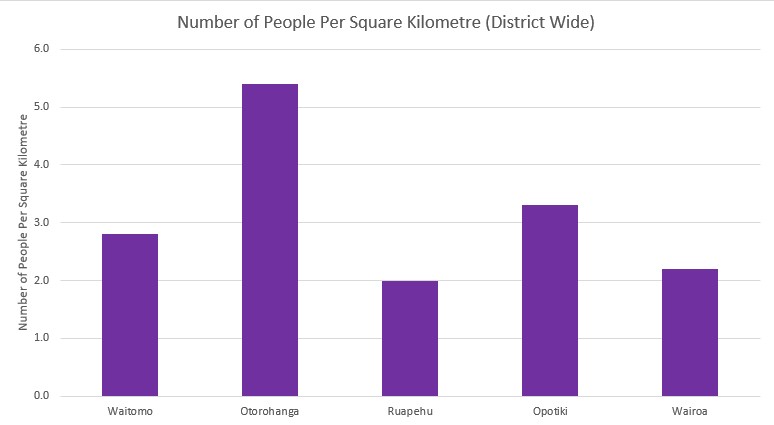
Otorohanga is the most densely populated, with just over 5 people per square kilometre. At the other end of the scale, Ruapehu has only 2 people per square kilometre. Waitomo sits just under 3 people per square kilometre, with Ōpōtiki slightly higher and Wairoa slightly lower.
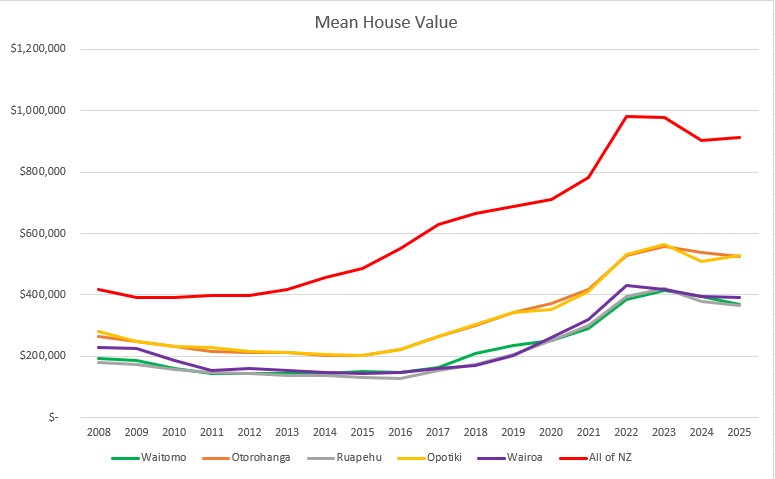
All five districts have mean house prices that are considerably below the national average.
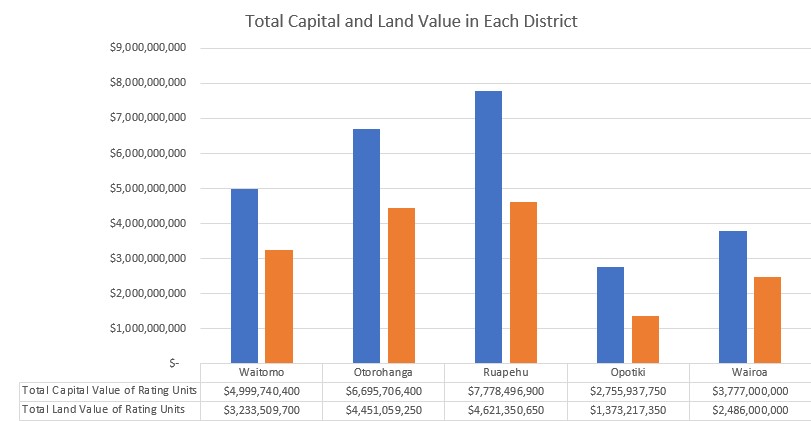
When we compare total property values across the districts, Ōpōtiki and Wairoa sit much lower — their combined property values are well below the others. Ruapehu is the highest, which makes sense given its larger size. Interestingly, Otorohanga, despite being a smaller district, has both a higher total capital value and a higher land value than Waitomo.
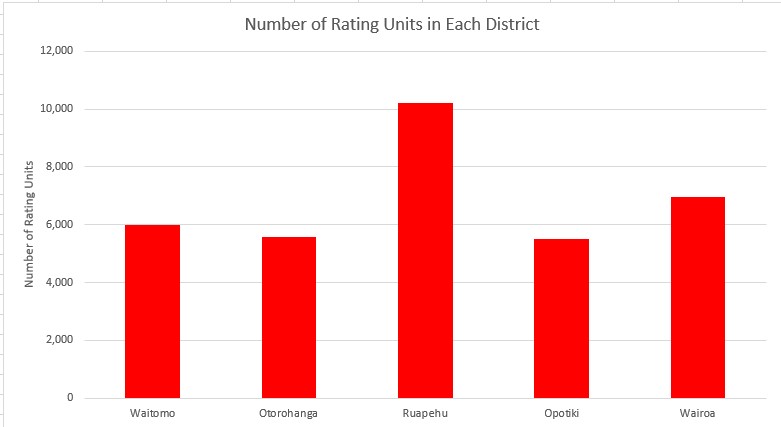
The final graph shows how many individual rating units there are in each district. Waitomo sits in the middle — with Otorohanga and Ōpōtiki having slightly fewer, and Wairoa a little more.
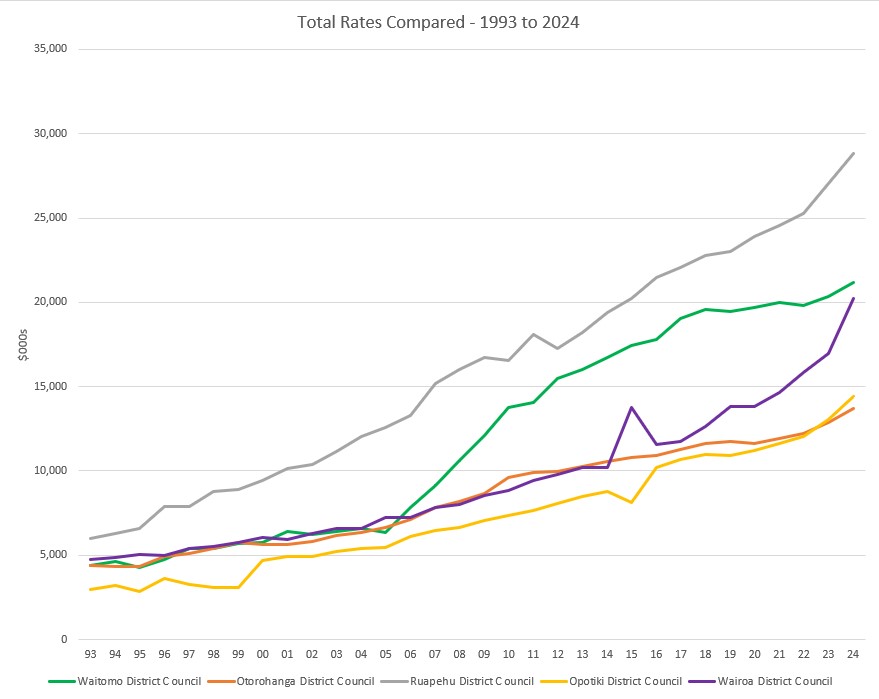
Looking at the first graph – Total Rates from 1993 to 2024 – you’ll see Waitomo as the green line. What really stands out is the sharp climb between 2005 and 2010, when our rates rose rapidly and steeply.
From there, I’ll take you step by step through each key service – roading, water, wastewater, and more – showing how Waitomo’s rates compare to our neighbours and how those costs are allocated to individual ratepayers across different districts.
If you want to truly understand what drives our rates, and what we can do differently, follow along — this is where it gets interesting.
If you would like a copy of this information in an easy to read PDF format please drop me a message.
|
||||||||||
   27 August 2025
Let’s clear the air on staff and governance costs. There’s been a lot of media chat about Council Chief Executive pay lately, which has sparked questions about what councils spend on staff and elected members.
So, before I dive into how Waitomo compares on services like roads, water and wastewater, here’s a snapshot of staff and governance costs across five councils:
Yes, Council Chief Executive salaries are high compared to everyday roles – but they’re well below private-sector equivalents, and the job is skilled and demanding. It’s one of the most critical roles to get right for any organisation’s success.
|
||||||||||
     30 August 2025
|
||||||||||
|
|
||||||||||
|
|
||||||||||
|
|
||||||||||
|
|
||||||||||


